


Editor’s Picks
Our latest reviews, insights and buyers’ guides


Top Project Management Tools
Hands-on reviews, head-to-head comparisons, and software alternatives from our experts


Find the Perfect Solution
Connect to top solutions and try them for yourself
Web App of the Month
Wrike
Create a single source of truth and align your teams and departments with Wrike. Automate workflows that maximize your productivity. Build automatic approvals, request forms, and repeatable blueprints so you can focus on your most valuable work.
Agile Software of the Month
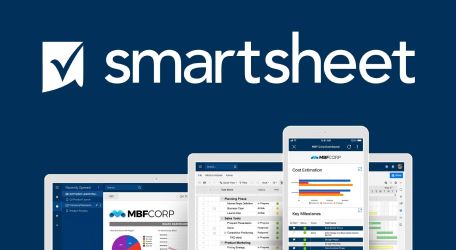
Smartsheet
Smartsheet is an online project management & task collaboration tool that is redefining how teams work. It has a familiar and easy to use spreadsheet-like interface, coupled with file sharing, Gantt charts, and work automation features.
Project Management Resources
Thankfully in today’s digital age, a few task management tools have come up to make the manager’s work easier.
Designed for project manager and business managers. It can also be for anyone who has a leading role in a project.
Deliver 100% online certification courses. Their portfolio includes but is not limited to: PMP, agile, scrum, ITIL, CAPM, etc.
Innovative e-learning company with a focus on project management and preparing for the PMP exam, scrum, ITIL, CAPM, etc.
Here is where to begin your search for an app that will perfectly fit your needs. All apps are listed by categories, which will ease your search accordingly.
Where should you study to get your PM certification? There are a lot of places who offer training. Here are our 5 picks.
Featured Partners: Project Management Software
{{ POSITION }}. {{ TITLE }}
project-management.com may receive a commission from vendors for referrals from this website.
Our Contributing Experts
We work with industry leaders and project management experts to bring you in-depth research and insights on software, tested tips, step-by-step guides, and real-world examples project management concepts and methodologies.
Lauren Good
In-depth, hands-on coverage of the PM, IT, security sectors
Anne Carroll
Veteran project management writer & consultant, digital team lead
Hannah Donato
Project management researcher, writer, video game producer & team lead
J.R. Johnivan
17 years’ experience covering PM, IT, networking, security, cloud computing
Shelby Hiter
Hands-on researcher, writer and editor, covering project management, IT, SaaS
Web Webster
Managing Editor, 30-year tech sector veteran, writer, editor, team lead
Partner with Us
Maintaining an online presence is key in the competitive project management software space. That’s why you should consider including project-management.com in your marketing mix.

6.1 million unique visitors per month
9 million unique page views per month
You’ll be in a good company of the world-leading SaaS brands


Latest How-To Guides
Our latest and greatest step by step